Joseph Gorak
Data Infrastructure for Traffic Data
This project was my introduction to the world of data science. It was a team-based project for a senior
capstone project. The goal was to extract Ohio traffic data
and centralize it to a database to create a tool for university researchers to conduct analysis. The sources
came from the Ohio Department of Transport, census data API, and Ohio crash
data. My main task was in data extraction for csv files found from these sources. Not only that, but I was to
create an upload tool for researches to upload different file types which
could be extracted and loaded into a database. The main exploration for this project was the concept of
creating an extract, transform, load (ETL) pipeline for the data, and
working on an application for database communication.
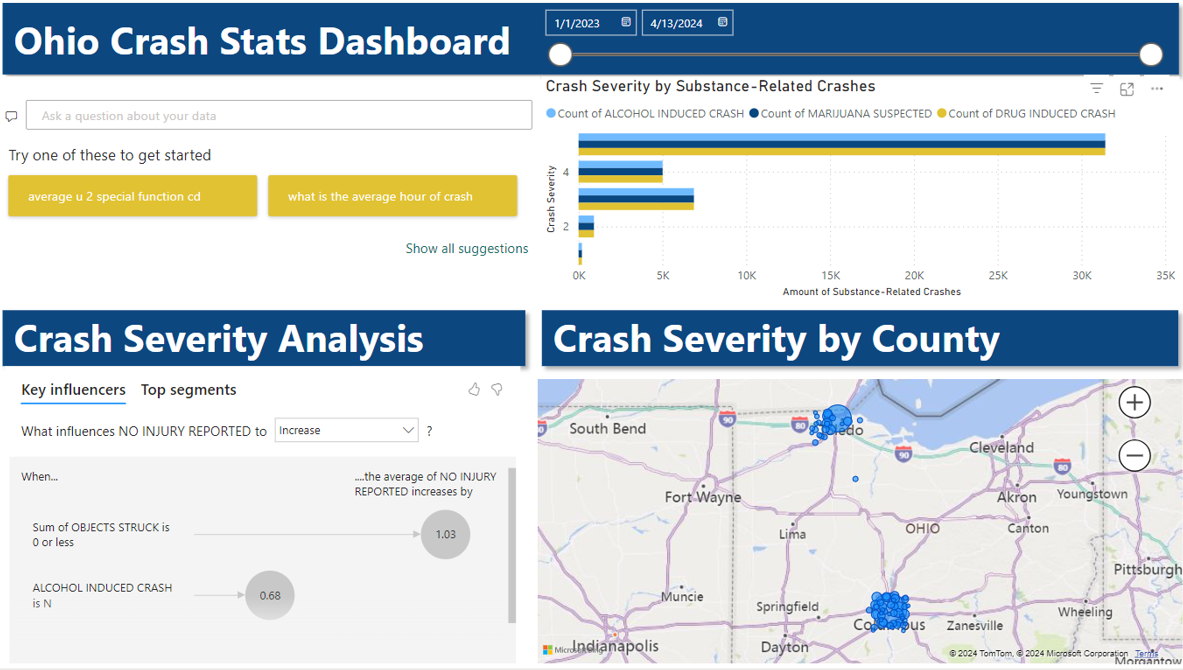
Seen below as a Microsoft Power BI developed for the data collected from the project. It allows for user
interactability to look at different aspects of crash data found in both
Lucas and Franklin county in Ohio.
Initial Design and Upload Tool
The initial design for the application would include three main aspects: Uploading data, interacting with
the database, and looking at different tables.
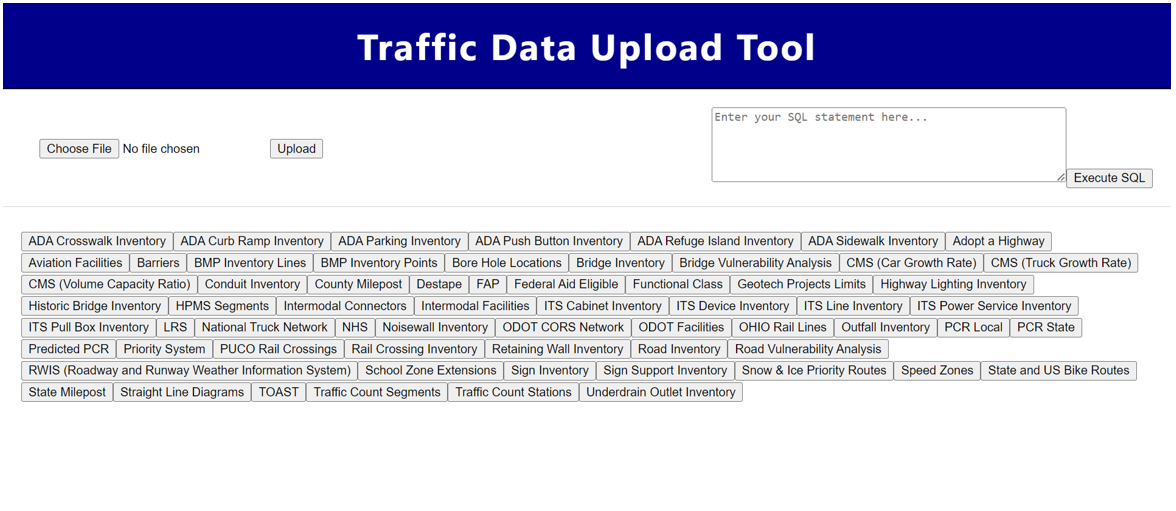
As noted above, my task was creating a robust upload tool where users can upload new data that may be relevant
towards their research. This application would
only be accessible to those deploying the research. I also had dynamic rendering for each relation in the
database on the application. The goal was for tables
to display, but due to project constraints and complications, there was not enough time for full
implementation.
Lessons Learned
There was a lot learned through this project. It was my first opportunity to be working together with a team
to create a product. At the same time, it was my first time
working with a client. This had led to specific hardships, as there was miscommunication between the team and
the client. As the project continued, the client wanted to change
the focus with the team completely, causing us to disregard our initial steps and put us extremely behind
schedule. Together, we discussed as a team how to handle the problem and
through teamwork were able to bring it back and continue development. It was a great lesson to value
communication with my teammates. It is important to make your goals and expectations extremely clear.
This project was a chance for me to delve deep into datascience. This involved looking at various types
of data, cleaning and transforming it, and collecting it into a database. It was my first
opportunity to do both data and database work, which developed my interest in machine learning. It also
provided a chance to get into back-end designed, as at the time I had only made a few static
front-end based websites. The concept of creating a communication workflow between a site and server is highly
interesting to me, and I wish to continue delving deeper into this type of development.
This was the first large-scale structured project I had undergone. It has given me skills in organization
and planning. The team had to create a Gantt chart to organize
project development and flow. There was also a project proposal and presentation half way through the semester
which was assessed and had feedback proposed to improve the project. This aided in resolving the
complications the team had with the client.
Skills Learned:
- Data science methodology and ETL pipeline
- Back-end design through javascript
- Communication with a client
- Handling project hardships
- Teamwork, leadership, communication